On Linux, if you want to display a FPS counter in your application, there are several ways to do so, but they depend on your hardware and the underlying 3D API being used (Vulkan or OpenGL). This short article will guide you through the different options available.
UPDATE: since the last revision of this article, a new FPS overlay was released for Linux. It’s called MangoHUD, and is better than all the options presented below in pretty much every way. It supports both Vulkan and OpenGL on any platform, is very configurable, can show other useful information like GPU temperature, and even record metrics for benchmarking. There’s really no point in using anything else on Linux at the moment. (which makes this whole article pretty much irrelevant).
Available options
| Intel | AMD | Nvidia | OpenGL | Vulkan | Comments | |
|---|---|---|---|---|---|---|
| Steam overlay | yes | yes | yes | yes | yes | Very basic (only FPS). Can work for non-Steam games if manually added to Steam. |
| Nvidia overlay | no | no | yes | yes | yes | Shows FPS, Vsync and Gsync status |
| Gallium HUD | Iris driver only | yes | no | yes | no | Very complete |
| Mesa Vulkan overlay | yes | yes | yes | no | yes | Works on Nvidia despite being part of Mesa. Lots of options. Allows logging to a text file. |
| GLXOSD | yes | yes | yes | yes | no | Discontinued by its author, but still works. Lots of options. |
| DXVK_HUD | yes | yes | yes | no | DXVK/D9VK only | Debug overlay for the DXVK project. |
Steam overlay
Many people are familiar with this one since it also exists on Windows. If you have a game on Steam and you want to display a FPS counter while playing it, simply launch the game (make sure the Steam Overlay is enabled), pop up the overlay (default shortcut is Shift+Tab), then go to Settings, In-Game, and “In-Game FPS counter”.
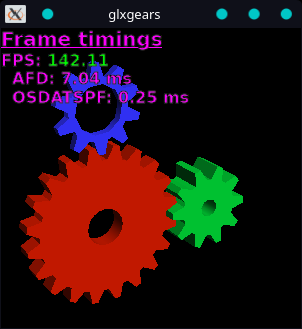
This overlay is very basic (only show a FPS counter and nothing else) but works for any hardware and 3D API. It can also work for non-Steam applications if you add them manually to Steam. Here it is showing up in glxgears :
However, it might be impossible to add your application to Steam if it already requires another launcher (like Lutris).
Nvidia overlay
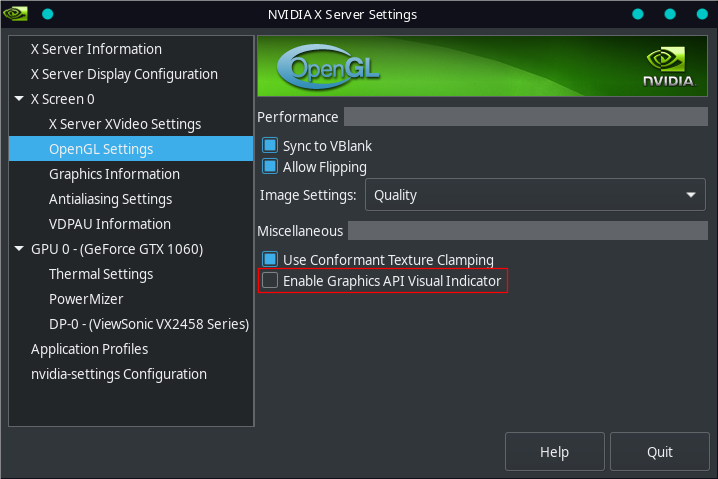
Like the name suggest, this one is only for Nvidia cards running on the proprietary driver. To enable it, open the Nvidia control panel (you can generally find it in your applications menu, or launch it with the command nvidia-settings), and tick the following box :
You can also use the environment variable __GL_SHOW_GRAPHICS_OSD=1.
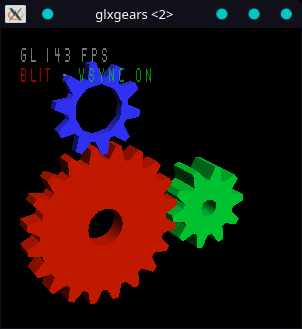
In addition to the FPS counter, this overlay also shows the 3D API used by the application (VK for Vulkan, GL for OpenGL) and, the Vsync status (ON or OFF).
If you have a G-Sync compatible display, you can also enable a “G-SYNC” indicator in the top-right corner that appears when G-Sync is active. For that, you need to also toggle “Enable G-SYNC/G-SYNC Compatible Visual Indicator” in the same page of the control panel (the option will appear if your monitor is compatible).
Gallium HUD
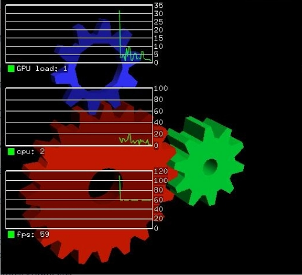
The Gallium HUD is probably one of the most complete overlays in this guide, since it can not only display a FPS counter, but also various useful values like GPU/CPU load (or even temperature if the drivers support it) and display them over time as graphs.
Unfortunately this overlay only works in OpenGL applications. Furthermore, it’s also limited to Mesa drivers that use the Gallium3D architecture : that includes the default AMD drivers and the open-source driver “nouveau” for Nvidia, but not the default Intel driver.
Intel users can still enable this overlay if they use the new “Iris” driver in Mesa, which is still in development but can be enabled manually.
The Gallium overlay should already be part of Mesa, so there is nothing else to install. To activate it, use the environment variable GALLIUM_HUD, ex : GALLIUM_HUD=fps glxgears. GALLIUM_HUD=help will print a list of available options.
There lots of options available, see here for a more exhaustive guide : https://manerosss.wordpress.com/2017/07/13/howto-gallium-hud/
Mesa Vulkan overlay
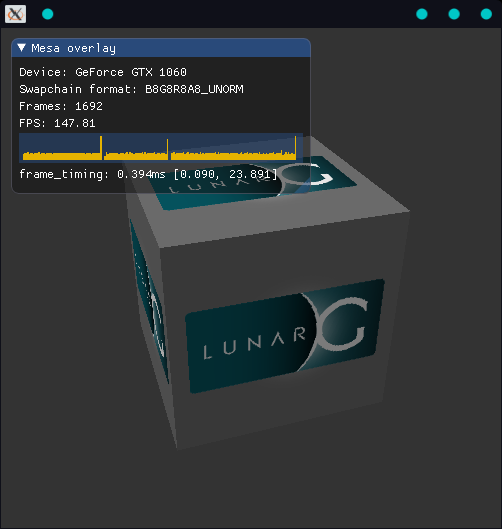
This overlay is a recent addition to Mesa. It only works for Vulkan applications, but since it’s built as a vendor-agnostic Vulkan overlay, it can be used on any hardware/driver combination. Including the proprietary Nvidia driver !
Unfortunately it’s a bit hard to install at this time. Because it’s so recent, it cannot be found in every distribution repository yet. Archlinux has it in its official repos under the name vulkan-mesa-layer, but the package only provides the 64-bit version of the overlay (therefore, it won’t work for 32-bit applications).
To bring support for 32-bit applications, I created a matching 32-bit package in the AUR : lib32-vulkan-mesa-layer. It can be installed alongside the 64-bit package. If you don’t use Arch or want to build the overlay yourself, you can refer to its PKGBUILD for building instructions.
To use the overlay, set the environment variable VK_INSTANCE_LAYERS=VK_LAYER_MESA_overlay. If the overlay does not appear, it could mean that the application is 32-bit and you need the 32-bit version of the layer installed as well.
The overlay can be configured with the environment variable VK_LAYER_MESA_OVERLAY_CONFIG. VK_LAYER_MESA_OVERLAY_CONFIG=help will print available options, which you can combine as a comma-separated list Example: VK_LAYER_MESA_OVERLAY_CONFIG=fps,position=top-left.
One very neat feature is the output_file option. It allows you to log the displayed values (like FPS or frametimes) to a file on the disk. Pretty useful for benchmarking.
GLXOSD
This one is quite older, and sadly, not maintained by its original author anymore. A real shame since it’s one of the most complete and flexible ones in this list. It’s limited to OpenGL, but according to its documentation, it can display useful info like temperature and GPU load, with specific plugins to deal with the proprietary Nvidia driver. I couldn’t get it to display more than basic FPS and frametimes info on my machine, but YMMV. It also supports logging to a file, and the logging can be started via a keybinding. Again, pretty useful for benchmarking.
The overlay can be enabled by starting the application with glxosd. Example : glxosd glxgears. Refer to the official documentation for more info : https://glxosd.nickguletskii.com/
DXVK_HUD
This one is not technically a general purpose overlay since it only works with DXVK and D9VK. But since many people use those two projects nowadays (via SteamPlay/Proton and Lutris), I thought it was good to include it.
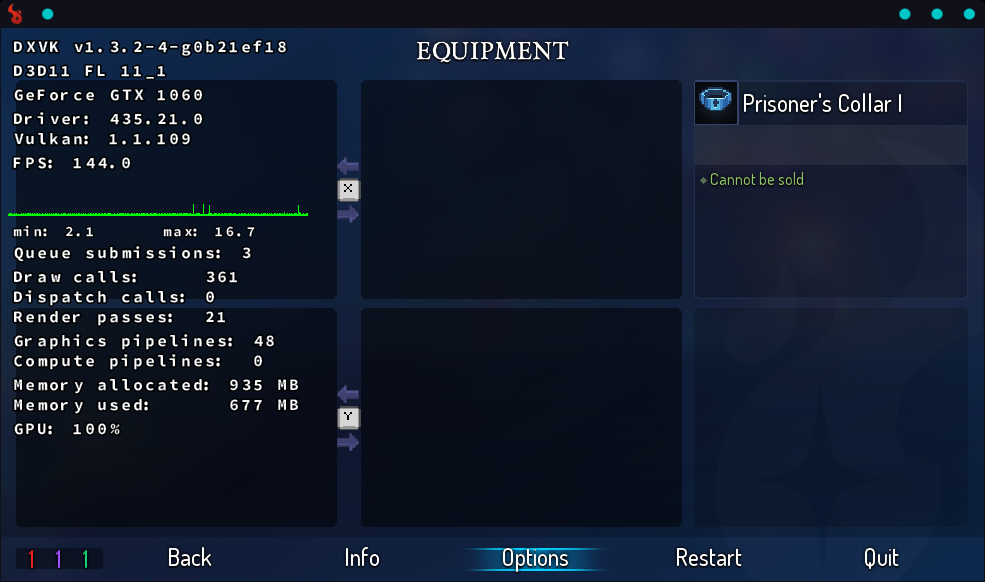
To use the overlay, simply set the environment variable DXVK_HUD (will work for D9VK too). DXVK_HUD=1 will use the default options, but there are more available (see the GitHub page for DXVK). It was never intended as more than a debug tool, so its features are somewhat limited. Nevertheless, it’s pretty handy since it works on any hardware and does not require any additional package.
Xosd (the ghetto method)
This is not a FPS overlay, but I thought it was still worth including it. Xosd is an applications that allows you to display any text as an overlay to your screen, so you can use it to show useful information like sensors temperature or anything else you want. It only works for X11, though (no Wayland).
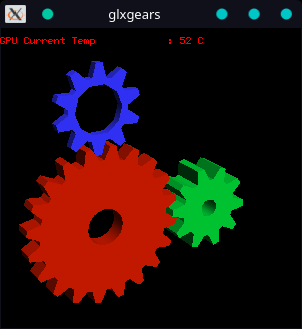
To use it, simply install the package xosd and pipe your text to the program osd_cat. As an example, here’s a simple one-liner to display GPU temperature with the proprietary Nvidia driver : while true; do nvidia-smi -q -d TEMPERATURE | grep "GPU Current Temp" | osd_cat; done.

